
Demand forecasting is tough when you have a rich set of historic figures. What methods can you use when data to guide your hardware startup forecasting is scarce?
Predicting Demand for Your Product
In theory, demand forecasting sounds simple: predict how much of your product customers will buy and then go and produce that amount. However, in actual practice, demand forecasting is much more complex. Predicting the future is always associated with some level of error – and it’s important that you quantify those errors and account for them in decision-making. Why? Depending on the magnitude of the error, forecasting inaccuracies can have a big impact on your business’ bottom line. For example, let’s say that you misjudge demand and produce more product than your customers need. This could cause your inventory costs to skyrocket as unwanted product sits on the shelves and accumulates dust. What if you’ve since made design iterations to upgrade your product? How do you deal with excess amounts of the older version?
On the other hand, you might inadvertently underestimate customer demand for your product. This could lead to you being unable to fulfill new orders for your product, thereby dissatisfying current customers and deterring future customers. Either way, you’re missing out on business you could have otherwise had. Or, it might mean that you’re pressuring your suppliers and manufacturers to keep up with orders when they don’t have enough capacity to fill them. Forecasting could even feed into your staffing decisions if you suddenly don’t have enough hands on deck to keep the business running smoothly. In any case, forecasting mistakes translate to real business costs. By quantifying your errors and understanding the best forecasting method for your business, you can alter future predictions to improve their accuracy. Over time, you’ll get closer and closer to predicting actual demand, thereby saving money and remaining competitive in the marketplace.
Forecasting Methods 101
There are a number of different methods that exist for forecasting demand. By understanding the benefits and drawbacks associated with each, you can make the most informed decision about the method that’s best for you. As you learn about the primary forecasting methods, keep in mind the following general rules: first, forecasts are not a single number; you need some associated measure of forecast error. Additionally, short-term forecasts are more accurate than long-term forecasts. For instance, you’ll be closer to actual demand when predicting this month’s forecast, as opposed to this year’s forecast. Similarly, aggregate forecasts are more accurate in comparison to individual forecasts. In other words, forecasting demand for all GMC trucks will be more accurate than predicting demand just for black GMC trucks.
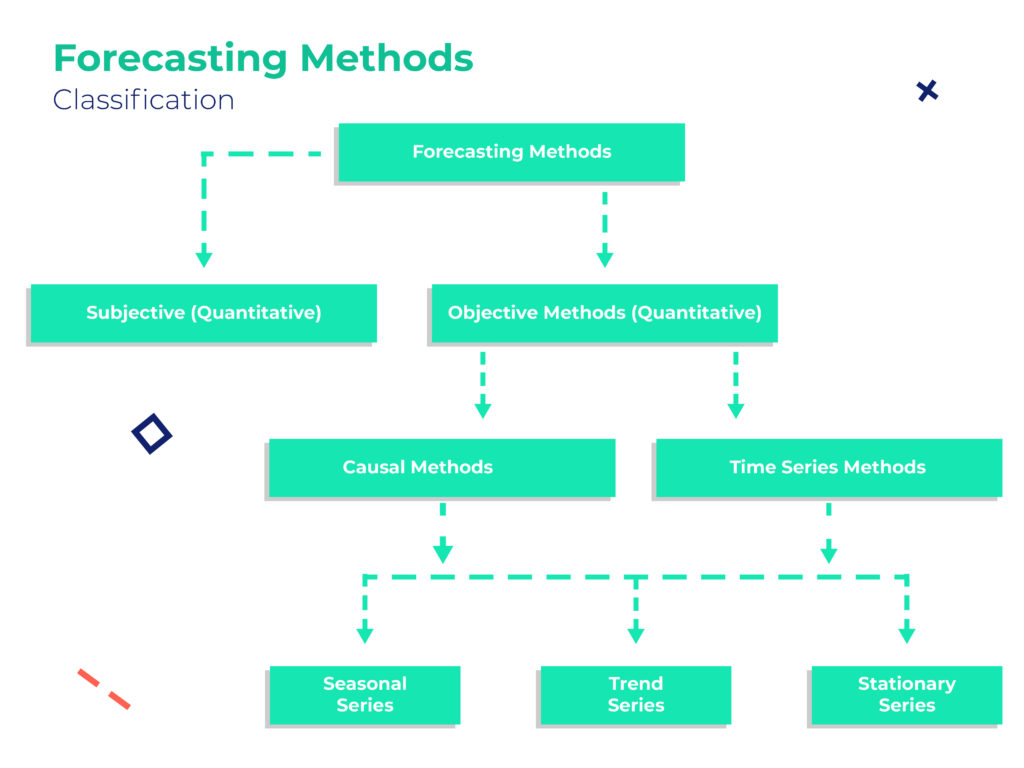
As you can see from the graphic below, there are two basic types of forecasting methods: 1) subjective and 2) objective. We’ll walk you through what each one entails and then break down the various objective methods in greater detail.
Subjective Forecasting Explained
As you might have guessed, subjective forecasts are qualitative in nature. Rather than being rooted in quantitative data analysis, they are based on opinions and different sources of judgement. When exactly would you want to apply this type of forecasting? Subjective methods are particularly relevant when you’re dealing with a new product that has no historical sales data. For many first-time hardware entrepreneurs, this is the method that they turn to (at least initially) to forecast demand.
To attain the insights that you need for an accurate subjective forecast, you can use sources like customer surveys, questionnaires, or even what is referred to as a jury of executive opinions. This is an iterative procedure based on the input of experts from different divisions within the organization (i.e. operations, marketing, sales, etc.). Some companies prefer to apply the Delphi Method – this is similar to the jury of executive opinions, but instead the analysis of expert opinions takes place offline via multiple, iterative rounds of questionnaires.
Objective Forecasting Explained
In contrast to subjective forecasts, objective forecasts are quantitative in nature. These methods rely on analyzing historical data to make inferences about future demands. As such, the decision to use subjective or objective forecasting methods generally depends on the availability of historical data. There are two primary kinds of objective forecasting methods: 1) causal methods and 2) time series methods, both of which are explained in greater detail below.
Causal Methods
Causal methods are based on analyzing a set of data that is different from the quantity that you would like to forecast. For example, you could analyze data containing median household incomes, school district rankings, and crime rates in order to ultimately forecast home sales for a certain area. The overall philosophy is to let the quantity that you want to forecast, “y”, be a function of some different variables, “x”. In equation form, this would be: y = f(x). Essentially, your objective with this method is to find the function that captures that relationship between y and x by analyzing historical data.
The most common tool used in causal methods is regression: simply put, a set of methods for determining the relationship among variables. You can deal with univariate regression (meaning y is a function of one variable x), or you can deal with multivariate regression (meaning y is a function of multiple x variables). The function f can either take a linear form, also known as linear regression, or it could take some other form (i.e. exponential, quadratic, etc.). Either way, it’s important to remember that even though two variables may be correlated, that does not necessarily imply causation.
Time Series Methods
When using this method, you analyze data similar to what you’d ultimately like to forecast. For instance, you could analyze the sales of smartphones from 2010 to 2017 in order to forecast demand for the same phone in 2018. As its name suggests, a time series is a collection of past values of the variable being predicted. Your goal is simple: isolate patterns in past data to predict future values. Naturally, although it sounds easy to do, execution is slightly more complicated. Based on the particular demand pattern, there are three different types of time series forecasting that you might use.
First is what is referred to as a Stationary Series, or when the historical demand data is randomly scattered about some constant value. With this type of forecasting, you calculate a moving average using exponential smoothing. Second is a Trend Series – when historical demand data exhibits an increasing (or decreasing) trend that can be linear or nonlinear. This involves univariate regression (with variable x representing time) and uses double exponential smoothing, or Holt’s Method. Finally, there is Seasonal Series, or data that reflects cyclical or seasonal variations in a consistent manner. This data may contain trends that are linear, exponential, or mixed, and that require triple exponential smoothing (also known as Winter’s Method).
Learning from Your Mistakes
Determining the demand pattern for your product (assuming you have historical data) is the first step towards selecting a forecasting method. For each demand series, there are dedicated forecasting methods that tend to work best – although landing on the right one for your business is sometimes more of an art than a science. That’s why many companies actually quantify their forecasting error using metrics so they can rank different forecasting methods against one another. Remember that forecasting error is the difference between the forecast (predicted) value and the actual realized value of demand at a certain point in time. Most businesses select a particular forecasting metric to calculate and compare, such as one from the table below:
| Mean Absolute Deviation (MAD) | Average of the absolute value of forecast errors over a specified time range |
|---|---|
| Mean Squared Error (MSE) | Average of the square of forecast errors on specified time range |
| Mean Absolute Percentage Error (MAPE) | Average of the absolute value of the ratio between forecast error and actual demand over a specified time range |
The idea is that better methods will yield lower values of such forecasting metrics. However, note that it’s uncommon for a particular forecasting method to yield lower values for all of these metrics. Typically, forecasters select a specific metric so they can compare methods in an “apples to apples” manner. At any rate, keep in mind that demand forecasting is iterative. By being diligent about continuously improving how you forecast over time, you’ll get closer to those real-life demand numbers.
Want more information on demand forecasting and how it impacts other parts of your business? Join our community of hardware entrepreneurs and we’ll send more content like this straight to your inbox.